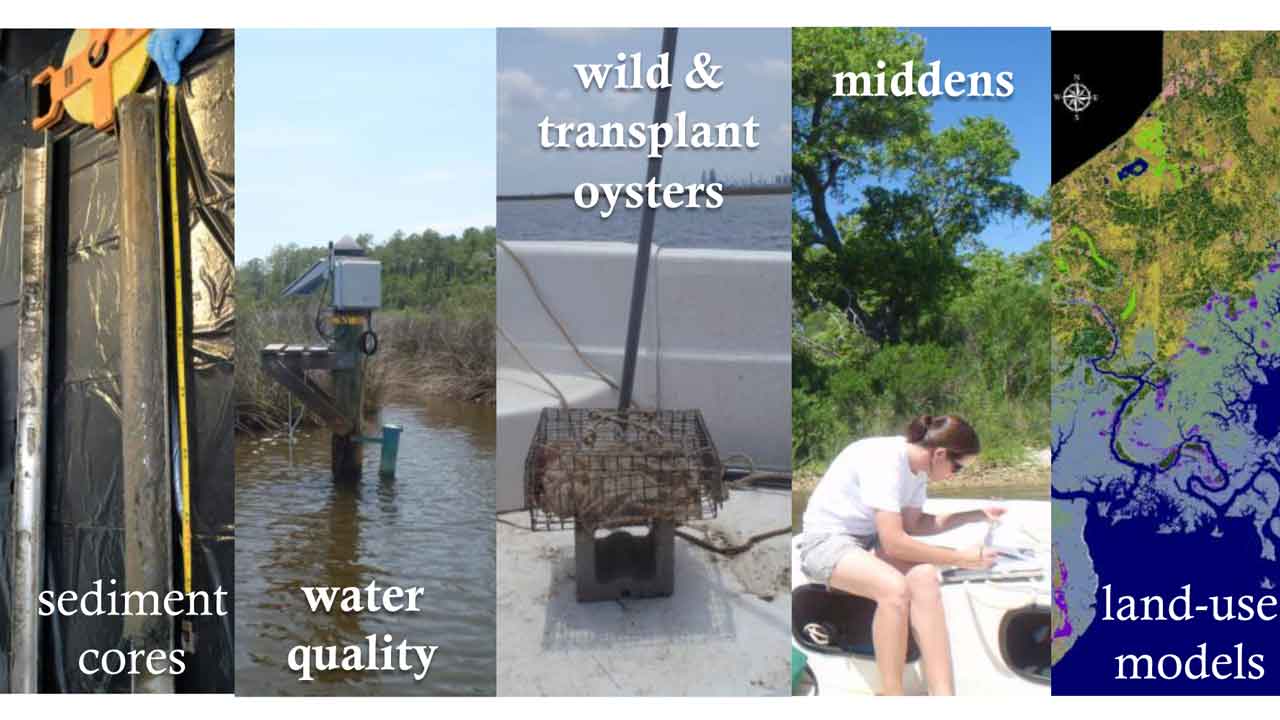
Methods
Our research traced and quantified indicators of nutrient and microbe inputs to the Grand Bay system through time. We combined data from sediment and water samples, oysters, environmental attributes, and land-use models. We also collected data at three local wastewater treatment plants to determine if nutrients and microbes from these facilities could be traced in the Grand Bay system.
Our analyses covered time periods from up to 3000 years before present (representing pre-urbanization endpoints) to 2020 (for projected land use) for four subwatersheds (Bangs Lake, Bayou Cumbest, Bayou Heron, and Bayou Chico, which are affected by a range of human activities and land use) and their receiving waters.
Changes in land use and associated increases in wastewater and stormwater have altered water quality and the ability to harvest shellfish in the Grand Bay system. We were able to relate land-use changes to historical ecological change and make predictions for the future.
Sediment Analyses
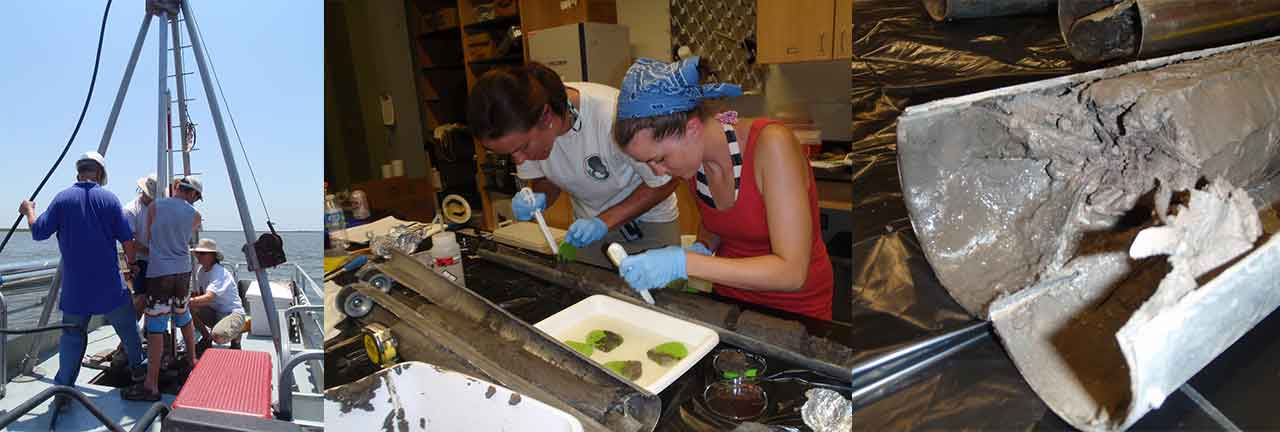
To collect data for the past decades in which most coastal urbanization has occurred, we analyzed sediment cores from undisturbed subtidal locations at each site, at a marine control site in the central portion of the Grand Bay system, Point Aux Chenes Bay, and at a wastewater-influenced control site, Bayou la Batre. In each sediment core, we:
- Measured carbon (C) and nitrogen (N) content (indicators of organic matter and nutrient loads).
- Determined stable isotope ratios (indicators of human nutrient sources and changes in salinity).
- Measured Clostridium perfringens (bacterial spores that indicate longer-term human health risk).
- Used radiometric dating (210Pb, 137Cs) to relate changes in sediments to changes on the watershed.
Water Analyses
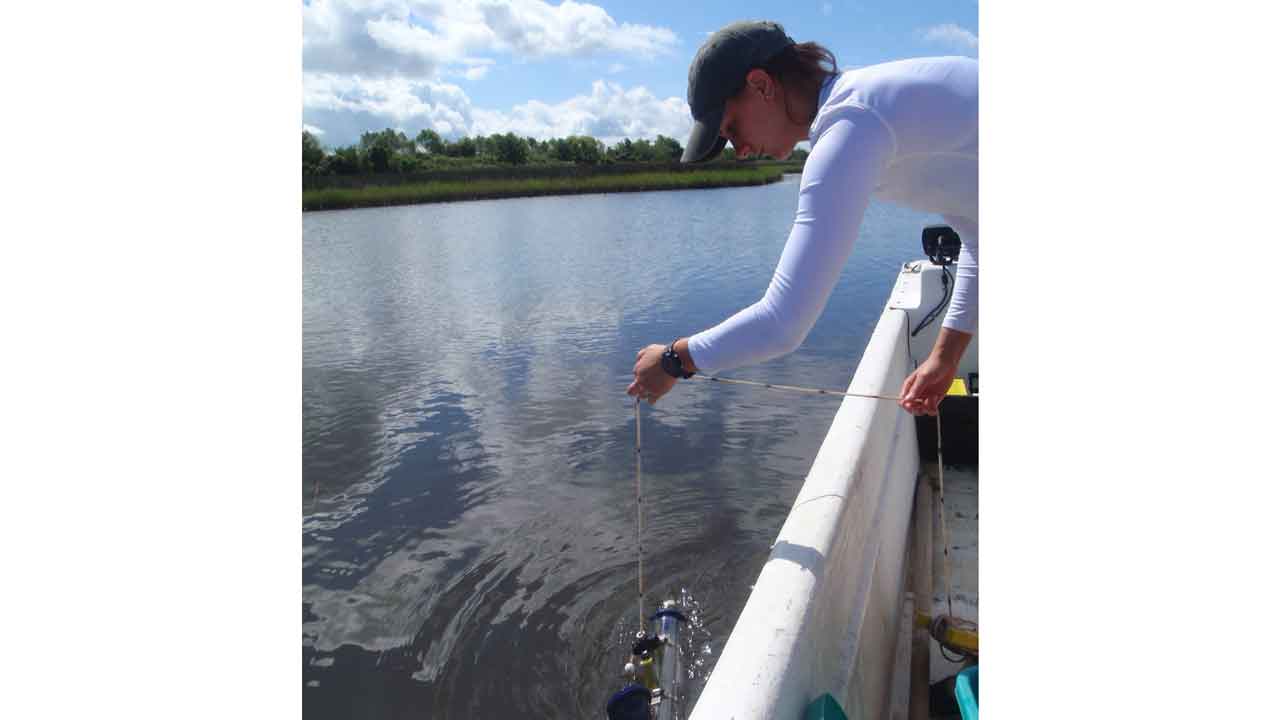
To define present-day effects on water quality, we collected water samples biweekly or monthly from each site. In each water sample, we measured:
- Particulate C and N content (indicators of organic matter and nutrient changes)
- Stable isotope ratios (indicators of human nutrient sources and changes in salinity)
- Dissolved nutrient concentrations (nitrate, nitrite, ammonium, organic nitrogen, phosphate)
- Chlorophyll a (indicator of phytoplankton biomass; food supply for oysters and other animals)
- Male-specific coliphage (MSC; an indicator of viruses such as Norovirus that can cause human illness)
- Fecal coliforms and E. coli (bacterial indicators that are commonly used to determine human health risk and shellfish area closures)
- Clostridium perfringens (bacterial spores that indicate longer-term human health risk).
Oyster Analyses
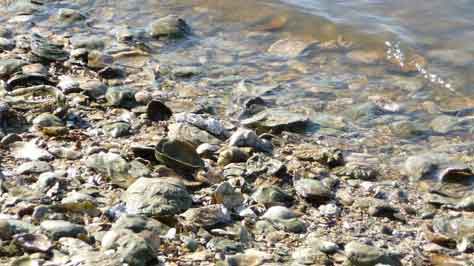
To determine how environmental changes affected oysters, which are commercially and ecologically valuable, we measured growth and survival patterns, stable isotope ratios (indicators of human nutrient sources and changes in salinity), and indicator microbes in oysters.
These effects were measured by transplanting oysters (Crassostrea virginica) to each study site in the Grand Bay system and testing a subset each month for the following indicator microbes:
- Male-specific coliphage (MSC; an indicator of viruses such as Norovirus that can cause human illness)
- Fecal coliforms and E. coli (bacterial indicators that are commonly used to determine human health risk and shellfish area closures)
- Clostridium perfingens (bacterial spores that indicate longer-term human health risk)
Wastewater Effluent Sampling
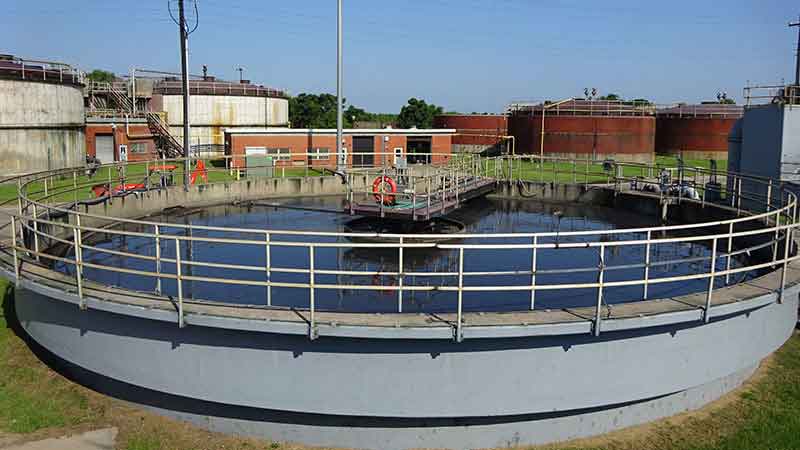
We sampled effluent from local wastewater treatment plant (WTP) outfalls including the Pascagoula/Moss Point WTP and Escatawpa WTP at the Pascagoula and Escatawpa Rivers in western Grand Bay and the Bayou La Batre WTP in eastern Grand Bay. We also conducted shoreline surveys for other actual and potential sources of nutrients and pathogens to the system. In each effluent sample, we measured:
- Particulate C and N content (indicators of organic matter and nutrient changes)
- Stable isotope ratios (indicators of human nutrient sources and changes in salinity)
- Dissolved nutrient concentrations (nitrate, nitrite, ammonium, organic nitrogen, phosphate)
- Male-specific coliphage (MSC; an indicator of viruses such as Norovirus that can cause human illness)
- Fecal coliforms and E. coli (bacterial indicators that are commonly used to determine human health risk and shellfish area closures)
- Clostridium perfingens (bacterial spores that indicate longer-term human health risk).
Land-use Modeling
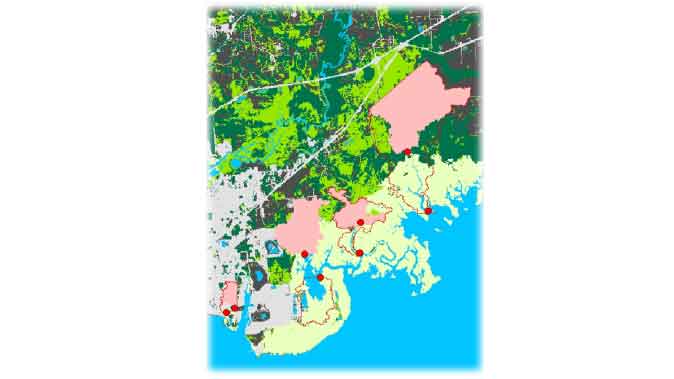
To classify and predict how land-use changes on Grand Bay watersheds affected water quality, we defined changes in impervious area as an index for urbanization at different time points from the 1960s to 2020. To do this, we compiled data from historical maps of land-use/land cover.
Data sources included:
- National wetland inventory (1955, 1979, 1988)
- NOAA C-CAP data (1996, 2001, 2005, 2006, 2010)
- Landsat imagery (every 3 years for 1984–2011)
- Quickbird imagery (2008)
- NLCD impervious area (2001, 2006, 2011)